Hey Friend, have you ever heard about the Hammer Candlestick Pattern? This is a super cool thing which traders use in the stock market for their decisions.
Think, a small candle appears on the chart which tells what is the mood of the market It is named hammer because it looks exactly like a hand. In this blog we will explain to you what is this hammer pattern,
Why it is important, and how you can easily understand it and use it in trading. Just read a little carefully and you too will become the boss of the chart!
I have written this article after a lot of research so that you get simple and correct information. I have seen trusted websites of candlestick trading,
YouTube tutorials, and #HammerPattern posts of traders on X. Plus, I also took tips from some popular trading books. Everything is written absolutely authentic and easy to understand,
Identifying the Hammer Candlestick Pattern
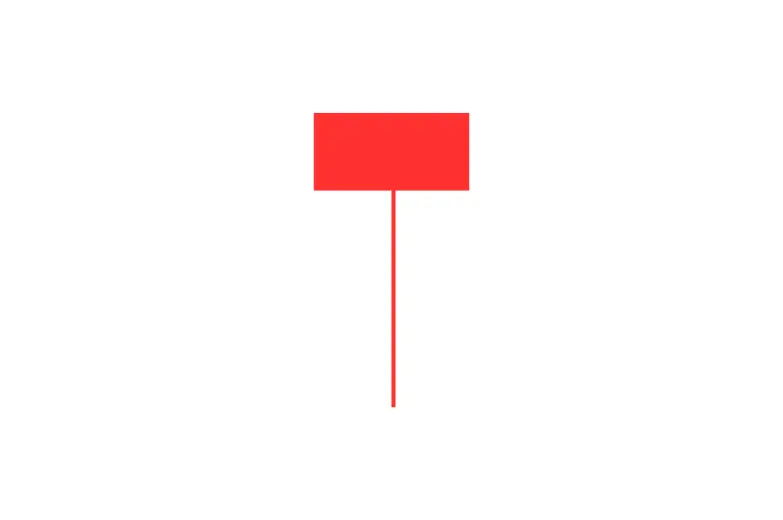
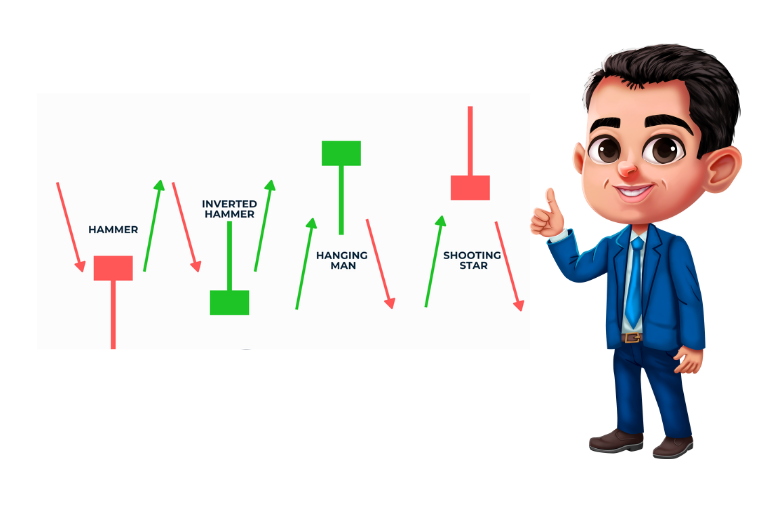
Let’s now understand how this hammer pattern looks! Picture this There is a candle with a small body a long shadow below, and either no shadow at all or a very small one above.
The shadow part gives it a hammer like look. Now there are two types of these
Bullish hammer and bearish hammer. Bullish hammer indicates that the market can now go up,
While bearish hammer is a bit tricky and depends on the context. It is easy to spot it on the chart just look carefully when the market is in a downtrend and this small body candle appears with a long lower shadow.
If you see it once you will understand, try it and see!
Meaning and Significance of the Hammer Pattern
Okay, now let’s talk about why this hammer pattern is so special Look, this candle is basically a reporter of the market mood. When it appears on the chart,
it indicates that the buyers have fought and given the sellers a little taunt. Mostly,
it appears at the end of a downtrend, meaning when prices are falling and then this hammer gives a signal that now the prices may go up this is called bullish reversal
This is a big hint for traders because it indicates that now may be the time to buy. That’s why this pattern is a game changer with a little understanding you can take advantage of it
Steps to Read the Hammer Pattern Correctly
Let’s now see step-by-step how to read the hammer pattern correctly Step
1: First check whether the market is in a downtrend or not meaning the prices are falling. Without a downtrend, the hammer has no meaning
2: Now look at the shape of the candle it should have a small body a long shadow below, and either no shadow or a very short one above.
3: To be a little extra smart, look at the volume or check the support levels if the volume is increasing then the signal is stronger.
4: Most importantly, wait for the next candle If it goes up then it is confirmed that the hammer is giving the right signal. Just follow these steps, and you will become a pro at catching the hammer

Using the Hammer Pattern in Trading
Now let’s talk about how to use this hammer pattern in trading Look, when you see the hammer and the next candle confirms that the prices are going up,
Then this is the time for entry meaning to buy the stock. Decide the exit point after some thought, like when the price gives a good profit.
Make sure to set a stop-loss so that if the market goes in the opposite direction your loss is limited usually you can place the stop-loss slightly below the shadow below the hammer.
Decide a target for take-profit, like a resistance level. And yes, to make the hammer even stronger use things like RSI or moving averages
if RSI is showing oversold then the signal is sure Practice a little and you will be able to use it effectively in trading,
Common Mistakes and How to Avoid Them
Brother, mistakes can also happen with the hammer pattern, but don’t worry, I will tell you how to avoid it
The biggest mistake is trading without confirmation that means you saw the hammer and you started buying or selling straightaway.
Wait for the next candle and confirm that the signal is correct! The second mistake is misjudging the trend
if the market is not in a downtrend, then there is no use of hammer, so first check the trend.
Thirdly, don’t make too much of indicators RSI, moving averages are fine, but if you fill the entire chart with indicators then your mind will spin. Just keep it simple
you saw the hammer, checked the trend took confirmation and traded. That’s it, and you will stay away from mistakes,
Real-World Examples

Come on, now let’s see some real world examples of how the hammer pattern works, I will give you two examples one of a successful trade and one of a failed trade
So that you can understand both sides. I will explain with charts, but since I cannot put actual charts here I will clearly describe what happened. Are you ready?
Example 1: Successful Hammer Trade (TCS Stock, 2023) Suppose TCS stock was in a downtrend in 2023, the price fell to around 3000 INR.
One day, a perfect hammer candle appeared on the daily chart small green body, long lower shadow which was two times longer than the body, and no shadow above.
This hammer formed near the support level of 3000 INR, which had already supported the price. Next day, a solid green candle formed which closed above the hammer high this was the confirmation,
I thought, This is a sure buy signal Entry was made at 3020 INR, stop-loss was placed below the hammer low (2980 INR) and target was set at 3100 INR as resistance there.
What happened? Price moved up to 3120 INR in a week and I booked a profit of 80 INR Success was achieved because the hammer was at the support level, the confirmation candle was strong and the volume was also increasing.
Example 2: Failed Hammer Trade (EUR/USD Forex Pair, 2024) Now let’s look at a failed case. I was looking at the 15-minute chart of the EUR/USD pair in 2024.
A small downtrend was going on and I saw a hammer candle small body, long lower shadow, everything looked good. Price was near 1.0800 and I thought this is the support level.
I waited for the next candle but it was a doji candle it neither went up nor down. Still, I took the risk and bought at 1.0820, placed a stop-loss at 1.0790.
But the market deceived me The next candle fell down, the stop-loss was hit, and the price went up to 1.0750. Why did it fail? Firstly,
The confirmation was weak the doji candle did not give a clear direction. Second, I did not check the volume, which was quite low meaning buyers had no guts. Learn not to trade without a solid confirmation
Both examples show that the hammer pattern is powerful, but without confirmation, volume, and context the risk increases. You should also practice on the charts and always place a stop-loss,
FAQ:
What is Hammer Candlestick Pattern?
Brother, this is a special type of candle which is seen on stock or forex charts. Its shape is like a palm small body, long lower shadow, and one or very small shadow above. It usually says that the market can go up after a downtrend. Just by understanding this, you can make smart moves in trading!
How to know if this is a hammer pattern?
This is easy First check if the market is in a downtrend or not. Then look for a candle on the chart which has a small body, a long shadow below and either no shadow above or a small one. If all this matches, then understand that this is a hammer Don’t forget to wait for the next candle for confirmation
What is the difference between Bullish and Bearish Hammer?
Bullish hammer appears at the end of a downtrend and indicates that prices may now go up. Bearish hammer is a little rarer and can appear at the end of an uptrend but its meaning depends on the context. Most traders focus on the bullish hammer as it gives a buy signal.
Does the hammer pattern always work?
No brother, no pattern is 100% perfect Sometimes the hammer fails, for example if the confirmation candle is weak or the volume is low. So always check the trend place a stop-loss, and also look at other indicators like RSI or support levels so that the risk is minimal.
How to start trading with Hammer pattern?
First practice on demo account When the hammer appears and confirms the next candle you can buy. Place the stop-loss below the low of the hammer and set the target at a slightly higher resistance level. You will gain confidence after a little practice Learn well before investing money in real trading,
Which mistakes should be avoided?
The biggest mistake is to trade without confirmation wait for the next candle Secondly, do not use the hammer in a wrong trend, like in an uptrend. And yes, do not put many indicators at once just 1-2 like volume or RSI are enough. Keep it simple otherwise your mind will spin
Conclusion
That’s it friend, now you must have understood the hammer candlestick pattern well It is a great tool which captures the mood of the market and gives a hint of a bullish reversal. Remember its steps, check the trend, see the shape of the hammer, get confirmation, and trade smartly. With a little practice you will become a pro in this. Now don’t leave it, try it on demo account and tell us the results of your trades Keep it simple and enjoy trading!