Hey friend, have you heard about candlestick patterns in stock trading? These are one type of charts which traders use to understand the mood of the market.
Think about it, just like you can guess from your friend’s face whether he is happy or sad, similarly candlestick patterns tell where the market is going.
Continuation candlestick patterns are those special signs which say that the market trend will not stop, it will move in the same direction.
These patterns are very useful for traders because due to them they are able to understand when to buy or sell a stock. In this article,
We will talk about what are these continuation patterns, what are their types and how you can use them in stock trading.
Let’s get started and Let us understand this interesting topic of the market
Research Note: I have written this article after researching candlestick patterns and stock trading from trusted sources such as TradingView blogs, Investopedia, and technical analysis books. Everything is written in simple and easy language so that you can understand easily!
Let’s move forward
What Are Continuation Candlestick Patterns?
Okay, so listen, what are continuation candlestick patterns? These are those patterns which show a small break in the market, meaning the trend stops for a while but then moves back in the same direction.
If the stock price is going up, then this pattern means that it will go up even after a little rest. In simple words, this is an indication that the trend is not over yet.
Now what is the difference between continuation and reversal patterns? Continuation traders say that the trend will continue
While reversal traders say that the trend will reverse, meaning if it was going up then it will come down Why do traders like these continuation patterns?
Because these give them confidence about where the price could go Due to these, traders are able to plan when to buy or when to hold These patterns are like market signals which make trading a little easier Let’s now look at their types
Types of Continuation Candlestick Patterns
Alright, now you will enjoy it as we are going to talk about types of continuation candlestick patterns. These are like different designs that are shown on the market charts. Let’s try one by one and see which are these patterns and how do they work?
1. Doji (Neutral Continuation)
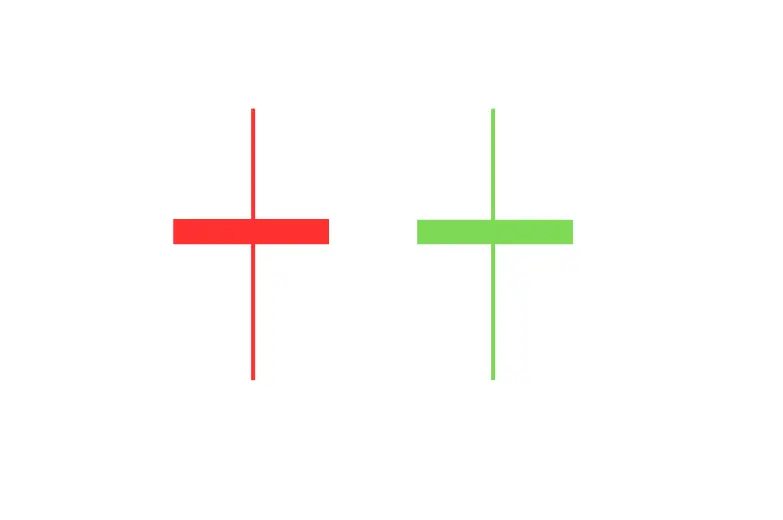
Brother, Doji is a small candle whose body is so small that it seems the market is confused, meaning it has neither gone too high nor low, but when this Doji comes in an uptrend or downtrend,
it says that the trend is still alive. For example, if a stock is going up and a Doji is seen, then understand that it is taking a little breath but will again go up.
It is easy to spot it, just look carefully. If the open and close price of the candle is almost the same, then it is a Doji. To use it in trading,
Go with the trend and wait for confirmation after the Doji. For example, when the next candle goes up, buy it.
2. Rising/Falling Three Methods
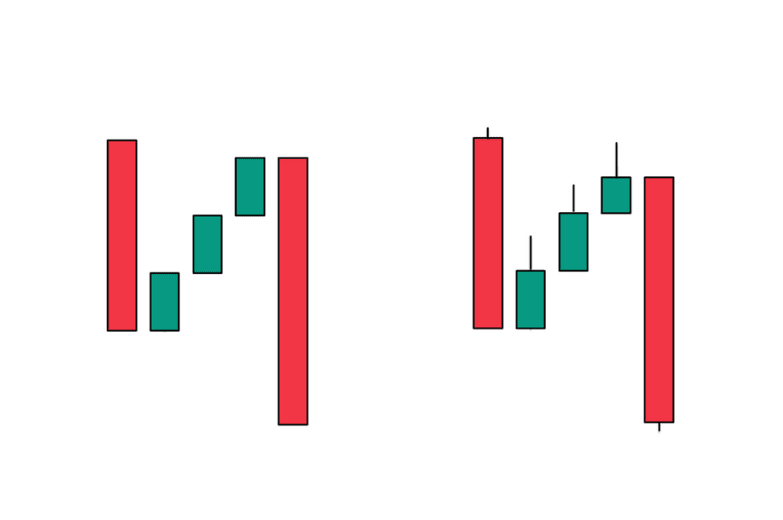
This pattern is a bit like a story. It has three small candles which come along with a big candle. If it is in uptrend then this is called Rising Three Method.
Meaning one big green candle, then three small red candles and then one big green candle. This pattern says that the bulls are still the boss. Its opposite happens in downtrend which is called Falling Three Method.
The trading tip is that once this pattern is complete, trade in the direction of the trend but keep in mind to check the volume as well for confirmation.
3. Triangles (Symmetrical, Ascending, Descending)
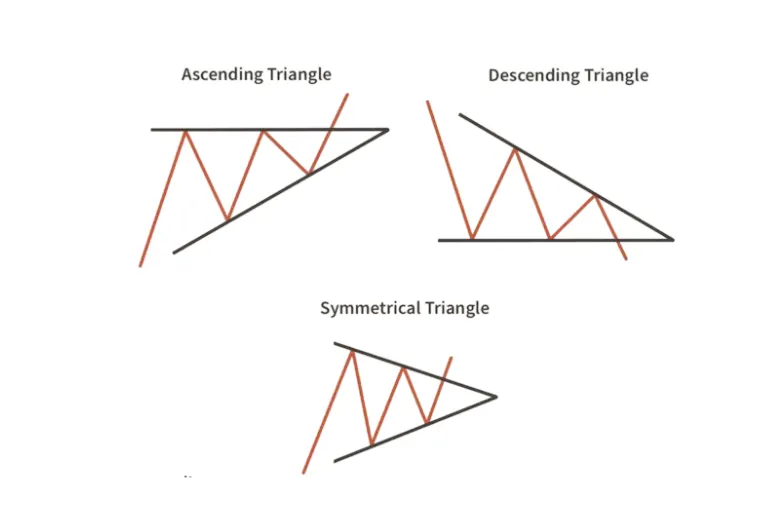
Triangles are like the rest zone of the market. It is formed when the price moves in a small range for a short time. In a Symmetrical triangle,
The price gets squeezed from both the sides. In an Ascending triangle, there is resistance on the upper side and support on the lower side in Descending.
All these are signs of continuation of the trend. It is easy to spot them on the chart. Just find the converging trendlines.
The trading strategy is that when the price breaks outside the triangle, trade in the same direction. Place a stop-loss for safety.
4. Pennants and Flags
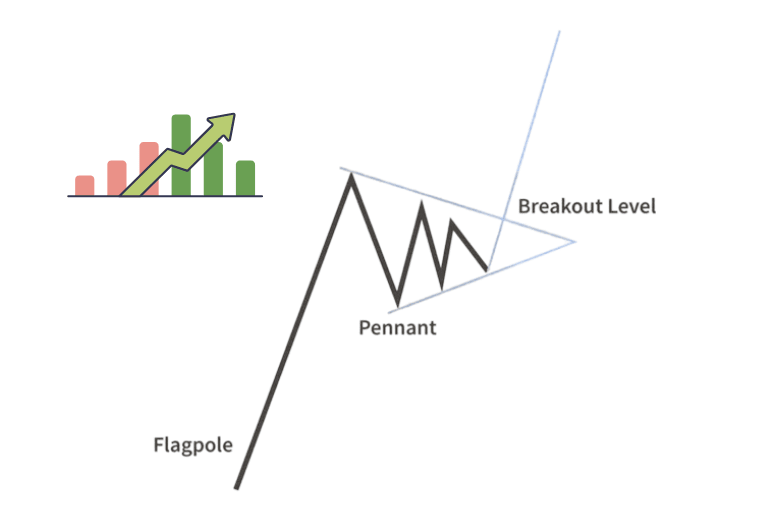
Both these patterns are like small triangles or rectangles that are formed in the middle of the trend. Pennant is a small triangle and Flag is a small rectangle.
Their meaning is that the market is chilling for some time but the trend will start back soon. The only difference is that in Pennant the lines converge and in Flag they remain parallel. To use them in trading
Take the trade after the break. For example if a Flag is formed in uptrend and the price breaks up then buy it. See the real example and you will understand.
5. Gaps (Continuation Gaps)
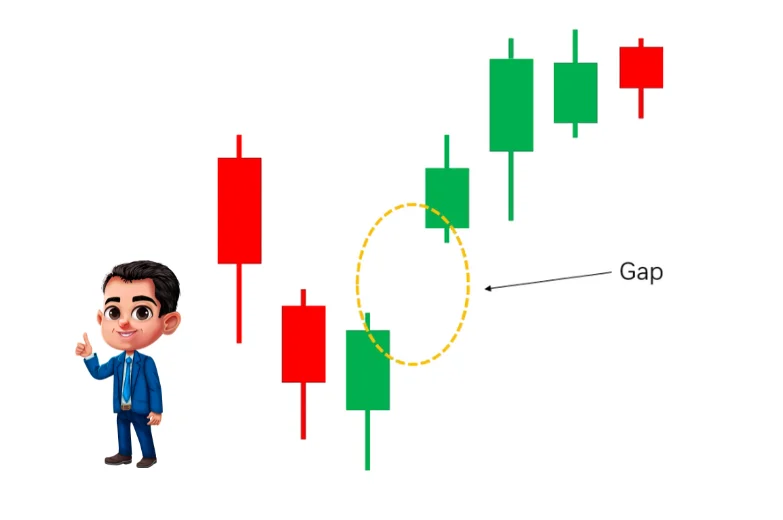
Gaps are a very important pattern. It occurs when price moves between one day’s close and the next day’s open for example, a stock closed at 100 and opened at 105 the next day.
Continuation gaps occur in the direction of the trend. Runway gap indicates that the trend is still fast, and Measuring gap indicates how far the trend can go.
To trade them, take a position in the direction of the gap, but first look for confirmation if the volume is high. Remember, gaps can be risky too, so place a stop-loss before moving on.
It takes a little practice to learn all these patterns but once you understand them, you gain great confidence in trading. If you have any doubts tell me I will explain further.
How to Identify Continuation Patterns in Charts
Brother, now let’s talk about how to find these continuation patterns on the chart. This is a bit of a detective thing, but once you understand it,
it is a lot of fun. First of all, you need a good chart, some platform like TradingView or MetaTrader, both of these are very user-friendly for students as well.
You can create a free account on TradingView and find the patterns on the charts. MetaTrader is a bit pro, but if you are working with a broker then you will find it there as well. Just open the chart and select the candlestick option, and then get started.
Now what do you want to look at? Three things are important: volume, trend direction and pattern confirmation Volume means how much trading is taking place,
if the volume is high then the pattern is more reliable Check the trend direction whether the market is going up or down,
Because the continuation pattern works in that direction Confirmation means an extra candle or signal that confirms the pattern Like after a Doji a big green candle confirms the uptrend But friend, mistakes also happen One common mistake is to assume the pattern in a hurry,
Do not trade without confirmation Another mistake is to rely on small time frames, look at slightly bigger time frames like daily chart, it will be more clear And yes,
Do not consider every candle as a pattern, have some patience, you will practice So you will catch your patterns, now open the charts and try.
Trading Strategies Using Continuation Patterns
Come on friend, now the real game begins, that is how to trade with continuation patterns. These patterns just give hints, but how to trade is known through strategy.
First of all, talk about entry and exit points. For example, if you see a triangle pattern and the price breaks above, then that is the entry point, meaning buy and wait for some time to exit.
When the trend starts getting tired or you see a reversal pattern, but patterns do not work alone, they need a little extra help. For this, use indicators like moving averages or RSI.
If you look at the moving average, you will know whether the trend is strong or not, and RSI will tell whether the market is overbought or oversold. Both of these are considered as patterns.
If you join them together, the signal becomes more firm Now risk management is very important Always place a stop-loss,
like if you bought in an uptrend, then keep the stop-loss a little below the pattern Position sizing means how much money are you putting in one trade
Do not invest all the money in one trade, divide it a little Want to see a real-world example? Suppose Reliance stock was going up and formed a pennant pattern, price broke up and volume was also high,
So a trader bought there, kept the stop-loss below and when the RSI went into the overbought zone, he sold it and made profit! Practice like this, understand the patterns and indicators and always keep the risk under control.
It will take some hard work but once you learn, you will enjoy trading. If you have any questions, tell me, I will explain you.
Benefits and Limitations of Continuation Patterns
Okay, now let us see what are the advantages and limitations of continuation patterns. It is important to understand this because everything has a plus and minus.
Let us first talk about the advantages. The biggest advantage is that these patterns give an indication about the trend. For example,
if the market is going up and a triangle pattern is seen, then you know that there is a high chance that it will go up. This gives confidence in trading decisions.
The second advantage is accuracy. Meaning, if you understand these patterns properly, then the chances of your trades being right increase. But now a little reality check is also important.
There are also limitations brother. When the market is choppy, that is, sometimes it goes up and sometimes it goes down. below, then these patterns can give wrong signals and one more important thing
before trusting these patterns you need confirmation, always check indicators like RSI or volume, otherwise money can be lost
So the thing is simple, patterns are very helpful but do not use them alone, practice a little and use them along with other tools, be smart in trading and learn from mistakes, if you have any doubts then tell me, I will clear it
FAQs
1. What is the difference between continuation and reversal candlestick patterns?
Continuation patterns say that the trend will move in the same direction, just as it is going up, it will go up. Reversal patterns say that the trend will change, just as it will come down from the top. That’s the only difference!
2. Can Continuation Patterns Be Used in Forex or Crypto Trading?
Yes brother, absolutely These patterns work in stocks, forex, crypto, everything. Just watch the market trend and volume carefully.
3. How reliable are continuation candlestick patterns?
If you do it with confirmation, like indicators or volume, then it is quite reliable. But there is some risk in choppy markets.
4. What are the best tools for spotting continuation patterns?
Tradingview and MetaTrader are the top. The charts are clear and patterns are easy to see. The free versions work too!
Conclusion
So friends, now we have learned a lot about continuation candlestick patterns. These patterns in stock trading give one kind of indication that the market trend will not stop, but will move in the same direction, be it Doji,
Triangle or Pennant, all these are very useful for traders because due to them you can take better decisions. But remember, these patterns are not magic wands,
you need practice to understand and use them. The best way is to try it on a demo account. You can view charts for free on platforms like TradingView and can find patterns.
If you work hard a little, confidence will come to you. And yes, if you liked this article. If you like it then share it with your friends, ask questions in the comments or read more trading guides.
It is fun to learn stock trading, just get started and enjoy. If you have any confusion then let me know, I am always here to help you.
Disclaimer: Intraday View is not a financial adviser please consult one. Do not share information that can identify you.
